Extract cqt/chroma_cqt
Simple extraction of cqt and chroma_cqt
 1import numpy as np
 2import audioflux as af
 3
 4# Get a 220Hz's audio file path
 5sample_path = af.utils.sample_path('220')
 6
 7# Read audio data and sample rate
 8audio_arr, sr = af.read(sample_path)
 9
10# Extract CQT
11cqt_arr, _ = af.cqt(audio_arr, samplate=sr)
12
13# Extract CQT_CHROMA
14chroma_cqt_arr = af.chroma_cqt(audio_arr, samplate=sr)
We recommend using the CQT class, you can use it more flexibly and efficiently.
1import numpy as np
2import audioflux as af
3
4# Get a 220Hz's audio file path
5sample_path = af.utils.sample_path('220')
6
7# Read audio data and sample rate
8audio_arr, sr = af.read(sample_path)
9
10# Create CQT object
11cqt_obj = af.CQT(num=84, samplate=sr)
12
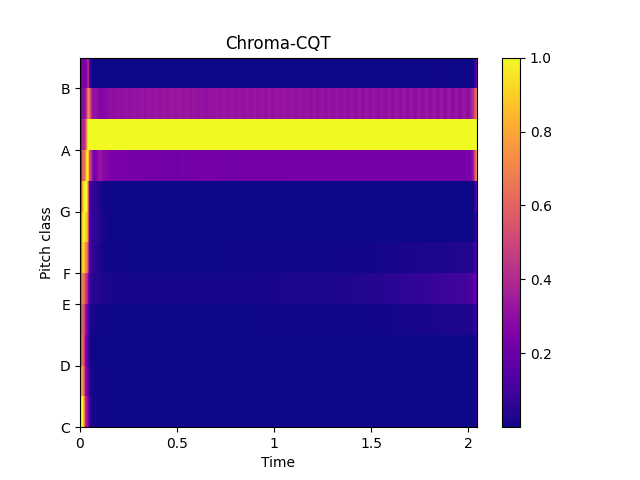
13# Extract CQT and Chroma_cqt
14cqt_arr = cqt_obj.cqt(audio_arr)
15chroma_cqt_arr = cqt_obj.chroma(cqt_arr)
16
17# Display
18import matplotlib.pyplot as plt
19from audioflux.display import fill_spec
20audio_len = audio_arr.shape[-1]
21
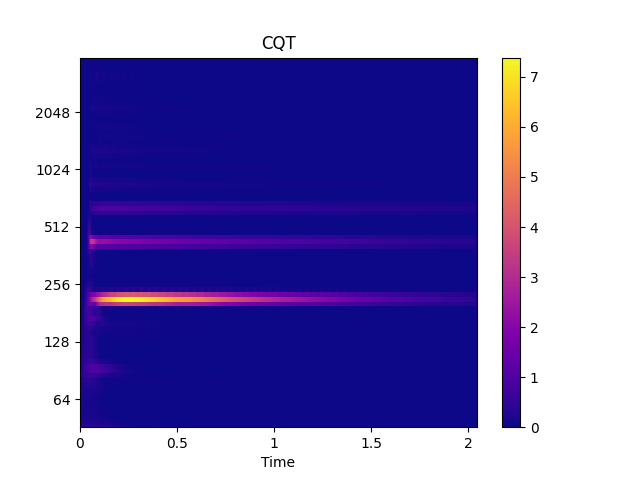
22# Display CQT
23fig, ax = plt.subplots()
24img = fill_spec(np.abs(cqt_arr), axes=ax,
25 x_coords=cqt_obj.x_coords(audio_len), x_axis='time',
26 y_coords=cqt_obj.y_coords(), y_axis='log',
27 title='CQT')
28fig.colorbar(img, ax=ax)
29
30# Display Chroma_cqt
31fig, ax = plt.subplots()
32img = fill_spec(chroma_cqt_arr, axes=ax,
33 x_coords=cqt_obj.x_coords(audio_len),
34 x_axis='time', y_axis='chroma',
35 title='Chroma-CQT')
36fig.colorbar(img, ax=ax)