Extract mel spectrogram
Simple extraction of mel spectrogram
 1import numpy as np
 2import audioflux as af
 3
 4# Get a 220Hz's audio file path
 5sample_path = af.utils.sample_path('220')
 6
 7# Read audio data and sample rate
 8audio_arr, sr = af.read(sample_path)
 9
10# Extract mel spectrogram
11spec_arr, _ = af.mel_spectrogram(audio_arr, samplate=sr)
We recommend using the BFT class, you can use it more flexibly and efficiently.
1import numpy as np
2import audioflux as af
3from audioflux.type import SpectralFilterBankScaleType
4
5# Get a 220Hz's audio file path
6sample_path = af.utils.sample_path('220')
7
8# Read audio data and sample rate
9audio_arr, sr = af.read(sample_path)
10
11# Create BFT object and extract mel spectrogram
12bft_obj = af.BFT(num=128, radix2_exp=12, samplate=sr,
13 scale_type=SpectralFilterBankScaleType.MEL)
14spec_arr = bft_obj.bft(audio_arr)
15spec_arr = np.abs(spec_arr)
16
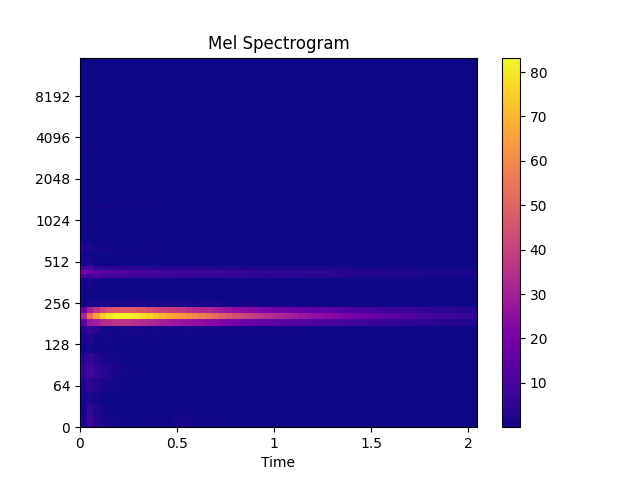
17# Display spectrogram
18import matplotlib.pyplot as plt
19from audioflux.display import fill_spec
20audio_len = audio_arr.shape[-1]
21fig, ax = plt.subplots()
22img = fill_spec(spec_arr, axes=ax,
23 x_coords=bft_obj.x_coords(audio_len),
24 y_coords=bft_obj.y_coords(),
25 x_axis='time', y_axis='log',
26 title='Mel Spectrogram')
27fig.colorbar(img, ax=ax)
Of course, BFT can not only extract the Mel spectrogram, but also extract the following spectrogram (just adjust the scale_type parameter):
Linear(STFT) - Short-time Fourier transform.
Linspace - Numbers evenly distributed over the specified interval.
Mel - Mel-scale spectrogram.
Bark - Bark-scale spectrogram.
Erb - Erb-scale spectrogram.
Octave - Octave-scale spectrogram.
Log - Evenly distributed numbers on a logarithmic scale.