CQT
- class audioflux.CQT(num=84, samplate=32000, low_fre=32.70319566257483, bin_per_octave=12, factor=1.0, beta=0.0, thresh=0.01, window_type=WindowType.HANN, slide_length=None, normal_type=SpectralFilterBankNormalType.AREA, is_scale=True)
Constant-Q transform (CQT)
- Parameters
- num: int
Number of frequency bins to generate, starting at low_fre.
Usually:
num = octave * bin_per_octave, default: 84 (7 * 12)- samplate: int:
Sampling rate of the incoming audio.
- low_fre: float
Lowest frequency. default: 32.703(C1)
- bin_per_octave: int
Number of bins per octave.
- factor: float
Factor value
- beta: float
Beta value
- thresh: float
Thresh value
- window_type: WindowType
Window type for each frame.
See:
type.WindowType- slide_length: int or None
Window sliding length.
- normal_type: SpectralFilterBankNormalType
Spectral filter normal type. It determines the type of normalization.
- is_scale: bool
Whether to use scale.
Examples
Read 220Hz audio data
>>> import audioflux as af
>>> audio_path = af.utils.sample_path('220')
>>> audio_arr, sr = af.read(audio_path)
Create CQT object
>>> from audioflux.type import SpectralFilterBankNormalType
>>> from audioflux.utils import note_to_hz
>>> obj = af.CQT(num=84, samplate=sr, low_fre=note_to_hz('C1'), bin_per_octave=12,
>>>              slide_length=1024, normal_type=SpectralFilterBankNormalType.AREA)
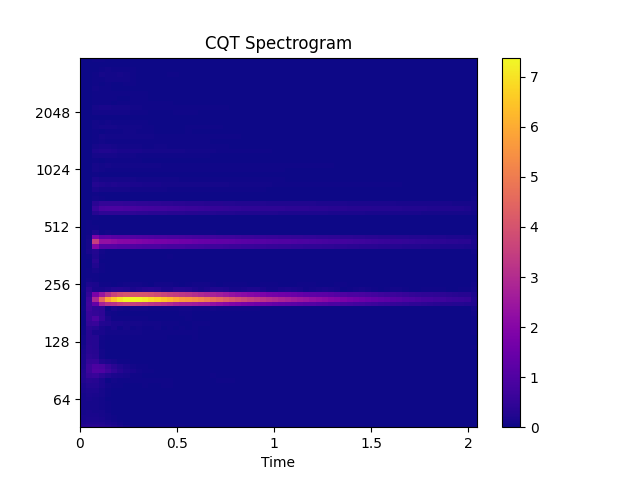
Extract CQT spectrogram
>>> import numpy as np
>>> spec_arr = obj.cqt(audio_arr)
>>> spec_mag_arr = np.abs(spec_arr)
Show CQT spectrogram plot
>>> import matplotlib.pyplot as plt
>>> from audioflux.display import fill_spec
>>> audio_len = audio_arr.shape[-1]
>>> fig, ax = plt.subplots()
>>> img = fill_spec(spec_mag_arr, axes=ax,
>>>           x_coords=obj.x_coords(audio_len),
>>>           y_coords=obj.y_coords(),
>>>           x_axis='time', y_axis='log',
>>>           title='CQT Spectrogram')
>>> fig.colorbar(img, ax=ax)
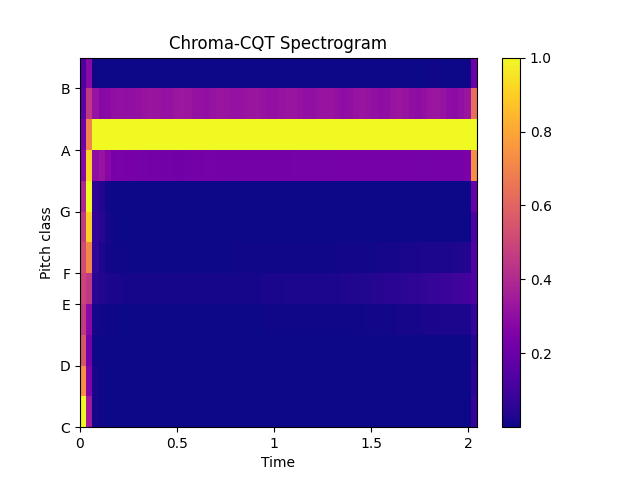
Extract Chroma-cqt data
>>> chroma_arr = obj.chroma(spec_arr, chroma_num=12)
Show Chroma-CQT spectrogram plot
>>> fig, ax = plt.subplots()
>>> img = fill_spec(chroma_arr, axes=ax,
>>>           x_coords=obj.x_coords(audio_len),
>>>           x_axis='time', y_axis='chroma',
>>>           title='Chroma-CQT Spectrogram')
>>> fig.colorbar(img, ax=ax)
Methods
cal_time_length(data_length)Calculate the length of a frame from audio data.
chroma(m_cqt_data[, chroma_num, data_type, ...])Calculate the chroma matrix of CQT
cqcc(m_data_arr[, cc_num, rectify_type])Compute the spectral cqcc feature.
cqhc(m_data_arr[, hc_num])Compute the spectral cqhc feature.
cqt(data_arr)Get spectrogram data
deconv(m_data_arr)Compute the spectral deconv feature.
get_fft_length()Get fft_length
get_fre_band_arr()Get an array of frequency bands of CQT scales.
set_scale([flag])Set scale
x_coords(data_length)Get the X-axis coordinate
y_coords()Get the Y-axis coordinate of CQT