Extract mfcc
Simple extraction of mfcc
 1import numpy as np
 2import audioflux as af
 3
 4# Get a 220Hz's audio file path
 5sample_path = af.utils.sample_path('220')
 6
 7# Read audio data and sample rate
 8audio_arr, sr = af.read(sample_path)
 9
10# Extract mfcc
11mfcc_arr, _ = af.mfcc(audio_arr, samplate=sr)
We recommend using the BFT and XXCC class, you can use it more flexibly and efficiently.
1import numpy as np
2import audioflux as af
3from audioflux.type import SpectralFilterBankScaleType, SpectralDataType
4
5# Get a 220Hz's audio file path
6sample_path = af.utils.sample_path('220')
7
8# Read audio data and sample rate
9audio_arr, sr = af.read(sample_path)
10
11# Create BFT object and extract mel spectrogram
12bft_obj = af.BFT(num=128, radix2_exp=12, samplate=sr,
13 scale_type=SpectralFilterBankScaleType.MEL,
14 data_type=SpectralDataType.POWER)
15spec_arr = bft_obj.bft(audio_arr)
16spec_arr = np.abs(spec_arr)
17
18# Create XXCC object and extract mfcc
19xxcc_obj = af.XXCC(bft_obj.num)
20xxcc_obj.set_time_length(time_length=spec_arr.shape[-1])
21mfcc_arr = xxcc_obj.xxcc(spec_arr)
22
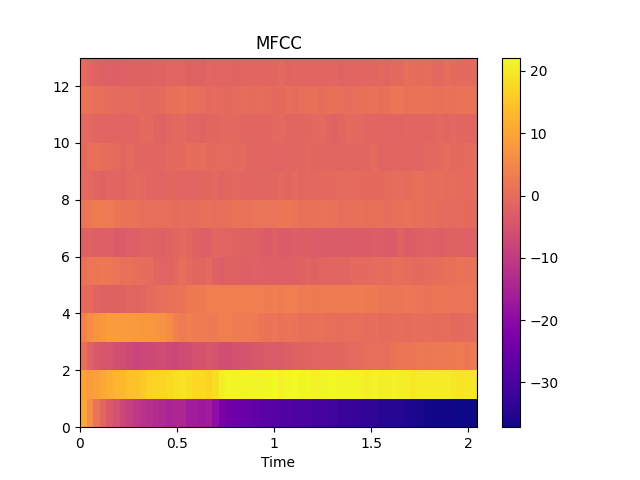
23# Display MFCC
24import matplotlib.pyplot as plt
25from audioflux.display import fill_spec
26audio_len = audio_arr.shape[-1]
27fig, ax = plt.subplots()
28img = fill_spec(mfcc_arr, axes=ax,
29 x_coords=bft_obj.x_coords(audio_len), x_axis='time',
30 title='MFCC')
31fig.colorbar(img, ax=ax)
Similar to mfcc, you can obtain various cepstral coefficients by adjusting the parameters of BFT and XXCC, such as bfcc/gtcc, etc.