Onset
- class audioflux.Onset(time_length, fre_length, slide_length, samplate=32000, filter_order=1, novelty_type=NoveltyType.FLUX)
Onset - Spectrum flux, novelty, etc algorithm
- Parameters
- time_length: int
The length of the time axis of the Spectrogram matrix
- fre_length: int
The length of the frequency axis of the Spectrogram matrix
- slide_length: int
Sliding length, needs to be the same as Spectrogram
- samplate: int
Sampling rate, needs to be the same as Spectrogram
- filter_order: int
Filter order
- novelty_type: NoveltyType
Novelty type
Examples
>>> import audioflux as af
>>> audio_arr, sr = af.read(af.utils.sample_path('guitar_chord1'))
>>> from audioflux.type import SpectralFilterBankScaleType, SpectralDataType
>>> import numpy as np
>>> bft_obj = af.BFT(num=128, samplate=sr, radix2_exp=12, slide_length=2048,
>>>                  scale_type=SpectralFilterBankScaleType.MEL,
>>>                  data_type=SpectralDataType.POWER)
>>> spec_arr = bft_obj.bft(audio_arr)
>>> spec_dB_arr = af.utils.power_to_db(np.abs(spec_arr))
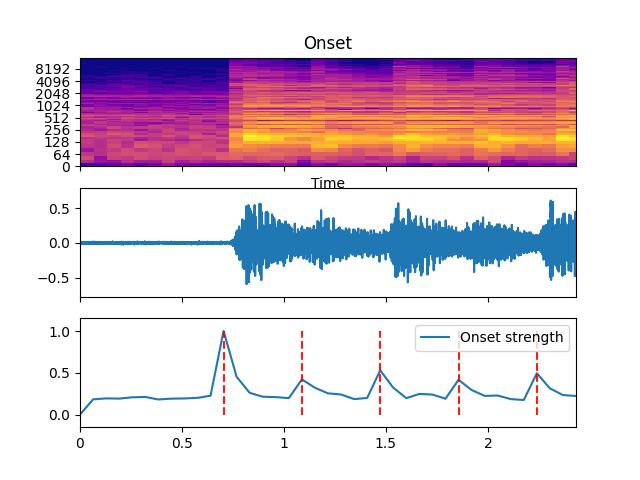
>>> from audioflux.type import NoveltyType
>>> n_fre, n_time = spec_dB_arr.shape
>>> onset_obj = af.Onset(time_length=n_time, fre_length=n_fre,
>>>                      slide_length=bft_obj.slide_length, samplate=bft_obj.samplate,
>>>                      novelty_type=NoveltyType.FLUX)
>>> params = af.NoveltyParam(1, 2, 0, 1, 0, 0, 0, 1)
>>> point_arr, evn_arr, time_arr, value_arr = onset_obj.onset(spec_dB_arr, novelty_param=params)
>>> import matplotlib.pyplot as plt
>>> from audioflux.display import fill_spec, fill_wave, fill_plot
>>> audio_len = audio_arr.shape[-1]
>>> fig, axes = plt.subplots(nrows=3, sharex=True)
>>> img = fill_spec(spec_dB_arr, axes=axes[0],
>>>                 x_coords=bft_obj.x_coords(audio_len),
>>>                 y_coords=bft_obj.y_coords(),
>>>                 x_axis='time', y_axis='log',
>>>                 title='Onset')
>>>
>>> ax = fill_wave(audio_arr, samplate=sr, axes=axes[1])
>>>
>>> times = np.arange(0, len(evn_arr)) * (bft_obj.slide_length / sr)
>>> ax = fill_plot(times, evn_arr, axes=axes[2], label='Onset strength')
>>> ax.vlines(time_arr, evn_arr.min(), evn_arr.max(), color='r', alpha=0.9,
>>>           linestyle='--', label='Onsets')
Methods
onset(m_data_arr1[, m_data_arr2, ...])Compute onset
- onset(m_data_arr1, m_data_arr2=None, novelty_param=None, index_arr=None)
Compute onset
- Parameters
- m_data_arr1: np.ndarray [shape=(…, fre, time)]
Input spec data.
- m_data_arr2: np.ndarray [shape=(…, fre, time)] or None
Input phase data. Provided when novelty_type is PD/WPD/NWPD/CD/RCD
- novelty_param: NoveltyParam or None
The parameters of the novelty_type corresponding method.
See:
NoveltyParam- index_arr: np.ndarray [shape=()] or None
The index of frequency array
- Returns
- point_arr: np.ndarray [shape=(…, time)]
- evn_arr: np.ndarray [shape=(…, time)]
- time_arr: np.ndarray [shape=(…, time)]
- value_arr: np.ndarray [shape=(…, time)]