HPSS
- class audioflux.HPSS(radix2_exp=12, window_type=WindowType.HAMM, slide_length=1024, h_order=21, p_order=31)
HPSS - Median filtering, NMF algorithm.
- Parameters
- radix2_exp: int
fft_length=2**radix2_exp- window_type: WindowType
Window type for each frame.
See:
type.WindowType- slide_length: int
Window sliding length.
- h_order: int
h order
- p_order: int
p order
Examples
Get a chord audio file with a metronome
>>> import audioflux as af
>>> audio_arr, sr = af.read(af.utils.sample_path('chord_metronome1'))
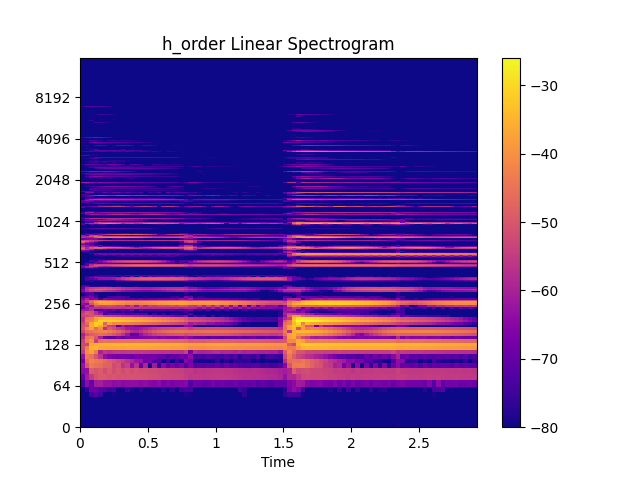
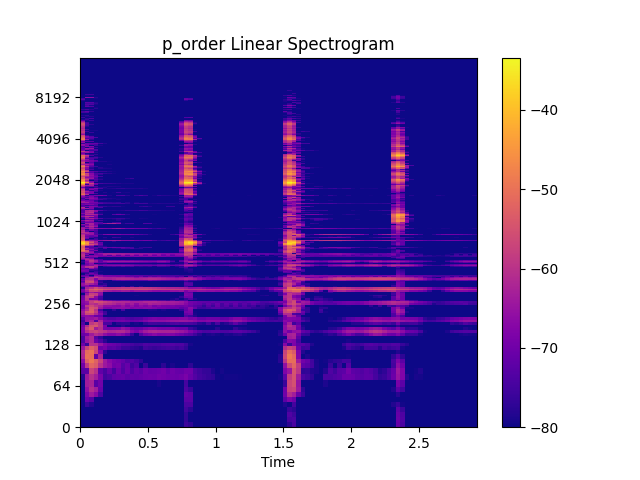
Create HPSS object and extrct h/p data
>>> from audioflux.type import WindowType
>>> radix2_exp = 11
>>> slide_length = (1 << radix2_exp) // 4
>>> hpss_obj = af.HPSS(radix2_exp=radix2_exp, window_type=WindowType.HAMM,
>>>                    slide_length=slide_length, h_order=21, p_order=31)
>>> h_arr, p_arr = hpss_obj.hpss(audio_arr)
>>> audio_len = h_arr.shape[-1]
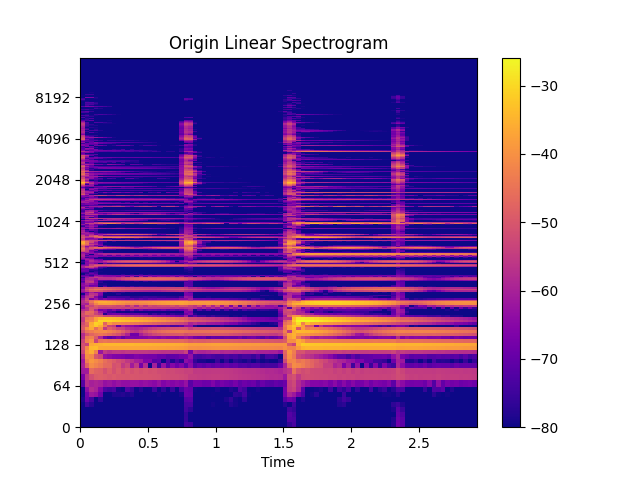
Disable Plot of Linear spectrogram
>>> import numpy as np
>>> from audioflux.type import SpectralFilterBankScaleType, SpectralDataType
>>> bft_obj = af.BFT(num=2049, radix2_exp=12, samplate=sr,
>>>                  scale_type=SpectralFilterBankScaleType.LINEAR,
>>>                  data_type=SpectralDataType.POWER)
>>> audio_arr = audio_arr[..., :audio_len]
>>> origin_spec_arr = bft_obj.bft(audio_arr, result_type=1)
>>> h_spec_arr = bft_obj.bft(h_arr, result_type=1)
>>> p_spec_arr = bft_obj.bft(p_arr, result_type=1)
>>> origin_spec_arr = af.utils.power_to_abs_db(origin_spec_arr)
>>> h_spec_arr = af.utils.power_to_abs_db(h_spec_arr)
>>> p_spec_arr = af.utils.power_to_abs_db(p_spec_arr)
>>> import matplotlib.pyplot as plt
>>> from audioflux.display import fill_spec
>>>
>>> fig, ax = plt.subplots()
>>> img = fill_spec(origin_spec_arr, axes=ax,
>>>           x_coords=bft_obj.x_coords(audio_len),
>>>           y_coords=bft_obj.y_coords(),
>>>           x_axis='time', y_axis='log',
>>>           title='Origin Linear Spectrogram')
>>> fig.colorbar(img, ax=ax)
>>>
>>> fig, ax = plt.subplots()
>>> img = fill_spec(h_spec_arr, axes=ax,
>>>           x_coords=bft_obj.x_coords(audio_len),
>>>           y_coords=bft_obj.y_coords(),
>>>           x_axis='time', y_axis='log',
>>>           title='h_order Linear Spectrogram')
>>> fig.colorbar(img, ax=ax)
>>>
>>> fig, ax = plt.subplots()
>>> img = fill_spec(p_spec_arr, axes=ax,
>>>           x_coords=bft_obj.x_coords(audio_len),
>>>           y_coords=bft_obj.y_coords(),
>>>           x_axis='time', y_axis='log',
>>>           title='p_order Linear Spectrogram')
>>> fig.colorbar(img, ax=ax)
Methods
cal_data_length(data_length)Calculate the data length.
hpss(data_arr)Compute the hpss
- cal_data_length(data_length)
Calculate the data length.
- Parameters
- data_length: int
Input array length
- Returns
- out: int
- hpss(data_arr)
Compute the hpss
- Parameters
- data_arr: np.ndarray [shape=(…, n)]
Audio data array
- Returns
- h_arr: np.ndarray [shape=(…, n)]
- p_arr: np.ndarray [shape=(…, n)]