Pitch
- class audioflux.PitchYIN(samplate=32000, low_fre=27.0, high_fre=2000.0, radix2_exp=12, slide_length=1024, auto_length=2048)
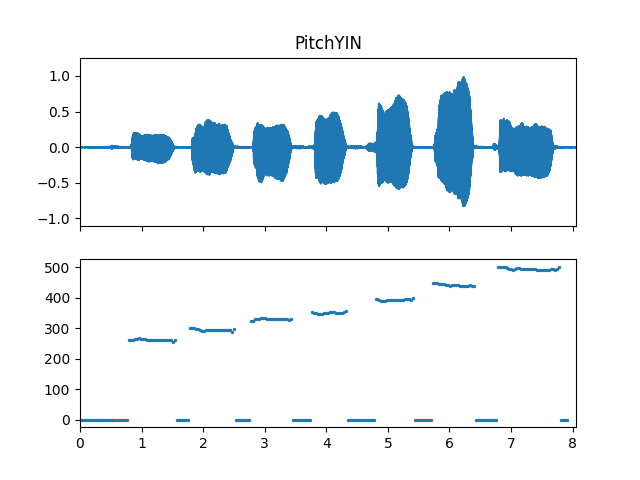
Pitch is estimated using time-domain differential autocorrelation. 1
- 1
Alain de Cheveigne, Hideki Kawahara. “YIN, a fundamental frequency estimator for speech and music.” 2002 Acoustical Societyof America.
- Parameters
- samplate: int
Sampling rate of the incoming audio.
- low_fre: float
Lowest frequency. Default is 27.0.
- high_fre: float
Highest frequency. Default is 2000.0.
- radix2_exp: int
fft_length=2**radix2_exp- slide_length: int
Window sliding length.
- auto_length: int
Auto correlation length. Default is 2048.
Examples
Read voice audio data
>>> import audioflux as af
>>> audio_path = af.utils.sample_path('voice')
>>> audio_arr, sr = af.read(audio_path)
Extract pitch
>>> pitch_obj = af.PitchYIN(samplate=sr)
>>> fre_arr, v1_arr, v2_arr = pitch_obj.pitch(audio_arr)
Show pitch plot
>>> import matplotlib.pyplot as plt
>>> times = np.arange(fre_arr.shape[-1]) * (pitch_obj.slide_length / sr)
>>> fig, ax = plt.subplots(nrows=2, sharex=True)
>>> ax[0].set_title('PitchYIN')
>>> af.display.fill_wave(audio_arr, samplate=sr, axes=ax[0])
>>> ax[1].scatter(times, fre_arr, s=2)
Methods
cal_time_length(data_length)Calculate the length of a frame from audio data.
pitch(data_arr)Compute pitch
set_thresh(thresh)Set thresh
- set_thresh(thresh)
Set thresh
- Parameters
- thresh: float
- cal_time_length(data_length)
Calculate the length of a frame from audio data.
fft_length = 2 ** radix2_exp(data_length - fft_length) // slide_length + 1
- Parameters
- data_length: int
The length of the data to be calculated.
- Returns
- out: int
- pitch(data_arr)
Compute pitch
- Parameters
- data_arr: np.ndarray [shape=(…, n)]
Input audio array
- Returns
- fre_arr: np.ndarray [shape=(…, time)]
- value1_arr: np.ndarray [shape=(…, time)]
- value2_arr: np.ndarray [shape=(…, time)]
- class audioflux.PitchPEF(samplate=32000, low_fre=32.0, high_fre=2000.0, cut_fre=4000.0, radix2_exp=12, slide_length=1024, window_type=WindowType.HAMM, alpha=10.0, beta=0.5, gamma=1.8)
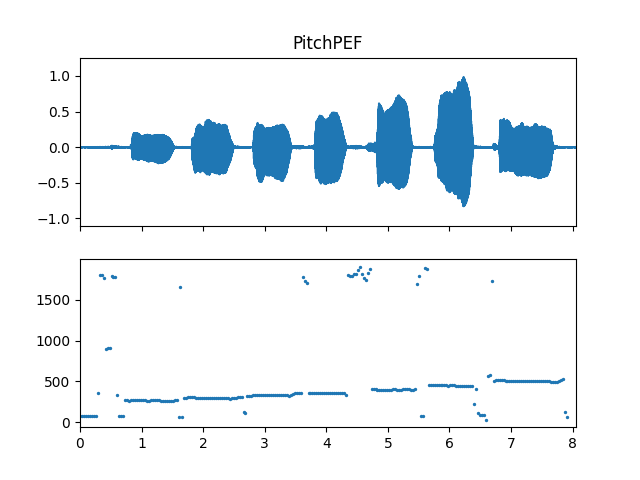
Pitch Estimation Filter(PEF). A pitch estimation filter is designed, and pitch is estimated by performing cross-correlation operations in the frequency domain. 2
- 2
Gonzalez, Sira, and Mike Brookes. “A Pitch Estimation Filter robust to high levels of noise (PEFAC).” 19th European Signal Processing Conference. Barcelona, 2011, pp. 451–455.
- Parameters
- samplate: int
Sampling rate of the incoming audio.
- low_fre: float
Lowest frequency. Default is 32.0.
- high_fre: float
Highest frequency. Default is 2000.0.
- cut_fre: float
Cut frequency. Default is 4000.0, and must be greater than high_fre.
- radix2_exp: int
fft_length=2**radix2_exp- slide_length: int
Window sliding length.
- window_type: WindowType
Window type for each frame.
See:
type.WindowType- alpha: float, > 0
alpha. Default if 10.0..
- beta: float, 0~1
beta. Default if 0.5..
- gamma: float, > 1
gamma. Default if 1.8.
Examples
Read voice audio data
>>> import audioflux as af
>>> audio_path = af.utils.sample_path('voice')
>>> audio_arr, sr = af.read(audio_path)
Extract pitch
>>> pitch_obj = af.PitchPEF(samplate=sr)
>>> fre_arr = pitch_obj.pitch(audio_arr)
Show pitch plot
>>> import matplotlib.pyplot as plt
>>> times = np.arange(fre_arr.shape[-1]) * (pitch_obj.slide_length / sr)
>>> fig, ax = plt.subplots(nrows=2, sharex=True)
>>> ax[0].set_title('PitchPEF')
>>> af.display.fill_wave(audio_arr, samplate=sr, axes=ax[0])
>>> ax[1].scatter(times, fre_arr, s=2)
Methods
cal_time_length(data_length)Calculate the length of a frame from audio data.
pitch(data_arr)Compute pitch
set_filter_params(alpha, beta, gamma)Set filter params
- cal_time_length(data_length)
Calculate the length of a frame from audio data.
fft_length = 2 ** radix2_exp(data_length - fft_length) // slide_length + 1
- Parameters
- data_length: int
The length of the data to be calculated.
- Returns
- out: int
- set_filter_params(alpha, beta, gamma)
Set filter params
- Parameters
- alpha: float
alpha
- beta: float
beta
- gamma: float
gamma
- pitch(data_arr)
Compute pitch
- Parameters
- data_arr: np.ndarray [shape=(…, n)]
Input audio array
- Returns
- fre_arr: np.ndarray [shape=(…, time)]
- class audioflux.PitchCEP(samplate=32000, low_fre=32.0, high_fre=2000.0, radix2_exp=12, slide_length=1024, window_type=WindowType.HAMM)
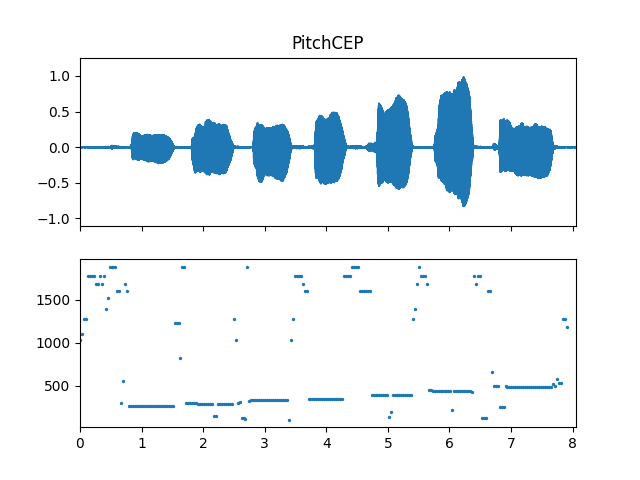
Cepstrum Pitch Determination(CEP). Pitch is estimated by performing a second FFT transformation on the spectrum and using cepstral analysis. 3
- 3
Noll, Michael A. “Cepstrum Pitch Determination.” The Journal of the Acoustical Society of America. Vol. 31, No. 2, 1967, pp. 293–309.
- Parameters
- samplate: int
Sampling rate of the incoming audio.
- low_fre: float
Lowest frequency. Default is 32.0.
- high_fre: float
Highest frequency. Default is 2000.0.
- radix2_exp: int
fft_length=2**radix2_exp- slide_length: int
Window sliding length.
- window_type: WindowType
Window type for each frame.
See:
type.WindowType
Examples
Read voice audio data
>>> import audioflux as af
>>> audio_path = af.utils.sample_path('voice')
>>> audio_arr, sr = af.read(audio_path)
Extract pitch
>>> pitch_obj = af.PitchCEP(samplate=sr)
>>> fre_arr = pitch_obj.pitch(audio_arr)
Show pitch plot
>>> import matplotlib.pyplot as plt
>>> times = np.arange(fre_arr.shape[-1]) * (pitch_obj.slide_length / sr)
>>> fig, ax = plt.subplots(nrows=2, sharex=True)
>>> ax[0].set_title('PitchCEP')
>>> af.display.fill_wave(audio_arr, samplate=sr, axes=ax[0])
>>> ax[1].scatter(times, fre_arr, s=2)
Methods
cal_time_length(data_length)Calculate the length of a frame from audio data.
pitch(data_arr)Compute pitch
- cal_time_length(data_length)
Calculate the length of a frame from audio data.
fft_length = 2 ** radix2_exp(data_length - fft_length) // slide_length + 1
- Parameters
- data_length: int
The length of the data to be calculated.
- Returns
- out: int
- pitch(data_arr)
Compute pitch
- Parameters
- data_arr: np.ndarray [shape=(…, n)]
Input audio array
- Returns
- fre_arr: np.ndarray [shape=(…, time)]
- class audioflux.PitchHPS(samplate=32000, low_fre=32.0, high_fre=2000.0, radix2_exp=12, slide_length=1024, window_type=WindowType.HAMM, harmonic_count=5)
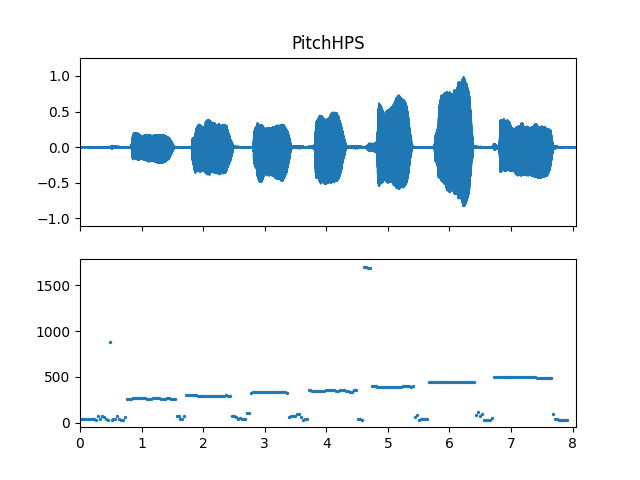
Dot-Harmonic Spectrum(HPS). Pitch is estimated by adopting dot operations on the harmonics of the spectrum. 4
- 4
Tamara Smyth. “Music270a: Signal Analysis.” 2019, Department of Music, University of California.
- Parameters
- samplate: int
Sampling rate of the incoming audio.
- low_fre: float
Lowest frequency. Default is 32.0.
- high_fre: float
Highest frequency. Default is 2000.0.
- radix2_exp: int
fft_length=2**radix2_exp- slide_length: int
Window sliding length.
- window_type: WindowType
Window type for each frame.
See:
type.WindowType- harmonic_count: int
Harmonic count. Default is 5.
Examples
Read voice audio data
>>> import audioflux as af
>>> audio_path = af.utils.sample_path('voice')
>>> audio_arr, sr = af.read(audio_path)
Extract pitch
>>> pitch_obj = af.PitchHPS(samplate=sr)
>>> fre_arr = pitch_obj.pitch(audio_arr)
Show pitch plot
>>> import matplotlib.pyplot as plt
>>> times = np.arange(fre_arr.shape[-1]) * (pitch_obj.slide_length / sr)
>>> fig, ax = plt.subplots(nrows=2, sharex=True)
>>> ax[0].set_title('PitchHPS')
>>> af.display.fill_wave(audio_arr, samplate=sr, axes=ax[0])
>>> ax[1].scatter(times, fre_arr, s=2)
Methods
cal_time_length(data_length)Calculate the length of a frame from audio data.
pitch(data_arr)Compute pitch
- cal_time_length(data_length)
Calculate the length of a frame from audio data.
fft_length = 2 ** radix2_exp(data_length - fft_length) // slide_length + 1
- Parameters
- data_length: int
The length of the data to be calculated.
- Returns
- out: int
- pitch(data_arr)
Compute pitch
- Parameters
- data_arr: np.ndarray [shape=(…, n)]
Input audio array
- Returns
- fre_arr: np.ndarray [shape=(…, time)]
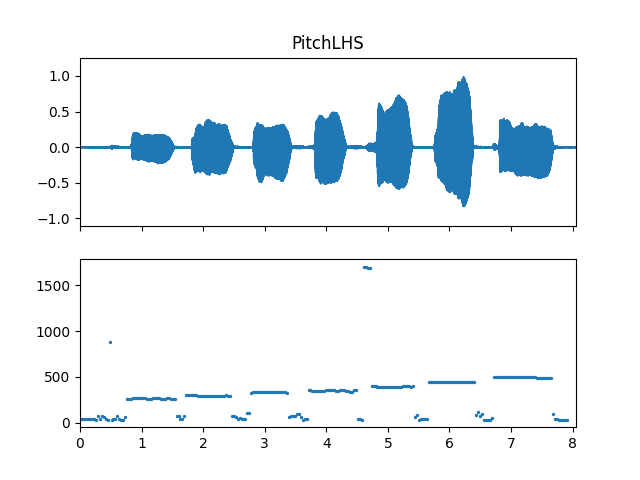
- class audioflux.PitchLHS(samplate=32000, low_fre=32.0, high_fre=2000.0, radix2_exp=12, slide_length=1024, window_type=WindowType.HAMM, harmonic_count=5)
Log-Harmonic Summation(LHS). Pitch is estimated by adopting sum operations on the harmonics of the spectrum. 5
- 5
Hermes, Dik J. “Measurement of Pitch by Subharmonic Summation.”The Journal of the Acoustical Society of America. Vol. 83, No. 1, 1988, pp. 257–264.
- Parameters
- samplate: int
Sampling rate of the incoming audio.
- low_fre: float
Lowest frequency. Default is 32.0.
- high_fre: float
Highest frequency. Default is 2000.0.
- radix2_exp: int
fft_length=2**radix2_exp- slide_length: int
Window sliding length.
- window_type: WindowType
Window type for each frame.
See:
type.WindowType- harmonic_count: int
Harmonic count. Default is 5.
Examples
Read voice audio data
>>> import audioflux as af
>>> audio_path = af.utils.sample_path('voice')
>>> audio_arr, sr = af.read(audio_path)
Extract pitch
>>> pitch_obj = af.PitchLHS(samplate=sr)
>>> fre_arr = pitch_obj.pitch(audio_arr)
Show pitch plot
>>> import matplotlib.pyplot as plt
>>> times = np.arange(fre_arr.shape[-1]) * (pitch_obj.slide_length / sr)
>>> fig, ax = plt.subplots(nrows=2, sharex=True)
>>> ax[0].set_title('PitchLHS')
>>> af.display.fill_wave(audio_arr, samplate=sr, axes=ax[0])
>>> ax[1].scatter(times, fre_arr, s=2)
Methods
cal_time_length(data_length)Calculate the length of a frame from audio data.
pitch(data_arr)Compute pitch
- cal_time_length(data_length)
Calculate the length of a frame from audio data.
fft_length = 2 ** radix2_exp(data_length - fft_length) / slide_length + 1
- Parameters
- data_length: int
The length of the data to be calculated.
- Returns
- out: int
- pitch(data_arr)
Compute pitch
- Parameters
- data_arr: np.ndarray [shape=(…, n)]
Input audio array
- Returns
- fre_arr: np.ndarray [shape=(…, time)]
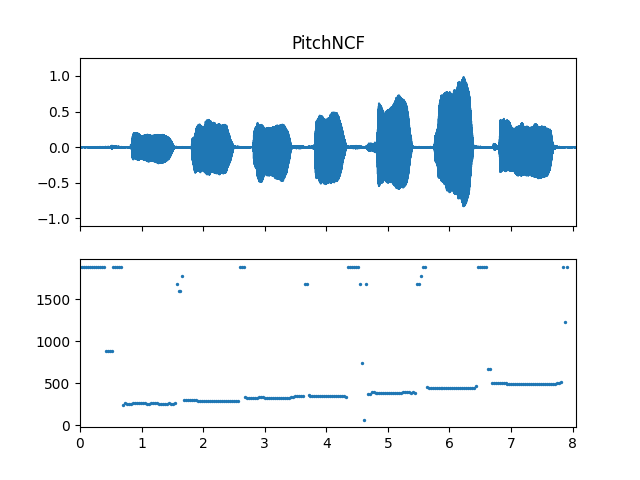
- class audioflux.PitchNCF(samplate=32000, low_fre=32.0, high_fre=2000.0, radix2_exp=12, slide_length=1024, window_type=WindowType.RECT)
Normalized Correlation Function(NCF). Pitch is estimated using normalized time-domain autocorrelation. 6
- 6
Atal, B.S. “Automatic Speaker Recognition Based on Pitch Contours.” The Journal of the Acoustical Society of America. Vol. 52, No. 6B, 1972, pp. 1687–1697.`
- Parameters
- samplate: int
Sampling rate of the incoming audio.
- low_fre: float
Lowest frequency. Default is 32.0.
- high_fre: float
Highest frequency. Default is 2000.0.
- radix2_exp: int
fft_length=2**radix2_exp- slide_length: int
Window sliding length.
- window_type: WindowType
Window type for each frame.
See:
type.WindowType
Examples
Read voice audio data
>>> import audioflux as af
>>> audio_path = af.utils.sample_path('voice')
>>> audio_arr, sr = af.read(audio_path)
Extract pitch
>>> pitch_obj = af.PitchNCF(samplate=sr)
>>> fre_arr = pitch_obj.pitch(audio_arr)
Show pitch plot
>>> import matplotlib.pyplot as plt
>>> times = np.arange(fre_arr.shape[-1]) * (pitch_obj.slide_length / sr)
>>> fig, ax = plt.subplots(nrows=2, sharex=True)
>>> ax[0].set_title('PitchNCF')
>>> af.display.fill_wave(audio_arr, samplate=sr, axes=ax[0])
>>> ax[1].scatter(times, fre_arr, s=2)
Methods
cal_time_length(data_length)Calculate the length of a frame from audio data.
pitch(data_arr)Compute pitch
- cal_time_length(data_length)
Calculate the length of a frame from audio data.
fft_length = 2 ** radix2_exp(data_length - fft_length) / slide_length + 1
- Parameters
- data_length: int
The length of the data to be calculated.
- Returns
- out: int
- pitch(data_arr)
Compute pitch
- Parameters
- data_arr: np.ndarray [shape=(…, n)]
Input audio array
- Returns
- fre_arr: np.ndarray [shape=(…, time)]
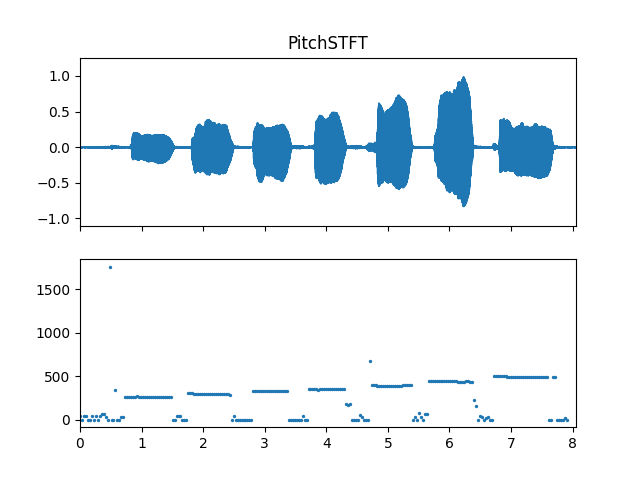
- class audioflux.PitchSTFT(samplate=32000, low_fre=32.0, high_fre=2000.0, radix2_exp=12, slide_length=1024, window_type=WindowType.HAMM)
Pitch STFT algorithm
- Parameters
- samplate: int
Sampling rate of the incoming audio.
- low_fre: float
Lowest frequency. Default is 32.0.
- high_fre: float
Highest frequency. Default is 2000.0.
- radix2_exp: int
fft_length=2**radix2_exp- slide_length: int
Window sliding length.
- window_type: WindowType
Window type for each frame.
See:
type.WindowType
Examples
Read voice audio data
>>> import audioflux as af
>>> audio_path = af.utils.sample_path('voice')
>>> audio_arr, sr = af.read(audio_path)
Extract pitch
>>> pitch_obj = af.PitchSTFT(samplate=sr)
>>> fre_arr, db_arr = pitch_obj.pitch(audio_arr)
Show pitch plot
>>> import matplotlib.pyplot as plt
>>> times = np.arange(fre_arr.shape[-1]) * (pitch_obj.slide_length / sr)
>>> fig, ax = plt.subplots(nrows=2, sharex=True)
>>> ax[0].set_title('PitchSTFT')
>>> af.display.fill_wave(audio_arr, samplate=sr, axes=ax[0])
>>> ax[1].scatter(times, fre_arr, s=2)
Methods
cal_time_length(data_length)Calculate the length of a frame from audio data.
pitch(data_arr)Compute pitch
- cal_time_length(data_length)
Calculate the length of a frame from audio data.
fft_length = 2 ** radix2_exp(data_length - fft_length) // slide_length + 1
- Parameters
- data_length: int
The length of the data to be calculated.
- Returns
- out: int
- pitch(data_arr)
Compute pitch
- Parameters
- data_arr: np.ndarray [shape=(…, n)]
Input audio array
- Returns
- fre_arr: np.ndarray [shape=(…, time)]
- db_arr: np.ndarray [shape=(…, time)]
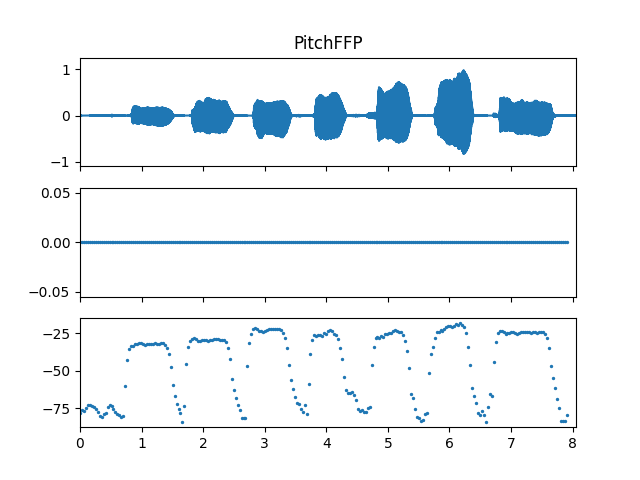
- class audioflux.PitchFFP(samplate=32000, low_fre=32.0, high_fre=2000.0, radix2_exp=12, slide_length=1024, window_type=WindowType.HAMM)
Pitch FFP algorithm
- Parameters
- samplate: int
Sampling rate of the incoming audio.
- low_fre: float
Lowest frequency. Default is 32.0.
- high_fre: float
Highest frequency. Default is 2000.0.
- radix2_exp: int
fft_length=2**radix2_exp- slide_length: int
Window sliding length.
- window_type: WindowType
Window type for each frame.
See:
type.WindowType
Examples
Read voice audio data
>>> import audioflux as af
>>> audio_path = af.utils.sample_path('voice')
>>> audio_arr, sr = af.read(audio_path)
Extract pitch
>>> pitch_obj = af.PitchFFP(samplate=sr, radix2_exp=12, low_fre=27, high_fre=2000,
>>>                         slide_length=1024, window_type=af.type.WindowType.HAMM)
>>> fre_arr, db_arr, extra_data_dic = pitch_obj.pitch(
>>>     audio_arr,
>>>     has_corr_data=True,
>>>     has_cut_data=True,
>>>     has_flag_data=True,
>>>     has_light_data=True,
>>>     has_temporal_data=True)
>>> cut_corr_arr, cut_db_arr, cut_height_arr, cut_length_arr = extra_data_dic['cut_data']
>>> flag_arr, = extra_data_dic['flag_data']
>>> light_arr, = extra_data_dic['light_data']
>>> avg_temp_arr, max_temp_arr, percent_temp_arr = extra_data_dic['temporal_data']
Show pitch plot
>>> import matplotlib.pyplot as plt
>>> times = np.arange(fre_arr.shape[-1]) * (pitch_obj.slide_length / sr)
>>>
>>> # Show pitch plot
>>> fig, ax = plt.subplots(nrows=3, sharex=True)
>>> ax[0].set_title('PitchFFP')
>>> af.display.fill_wave(audio_arr, axes=ax[0])
>>> ax[1].scatter(times, fre_arr, s=2)
>>> ax[2].scatter(times, db_arr, s=2)
>>>
>>> # Show cut data plot
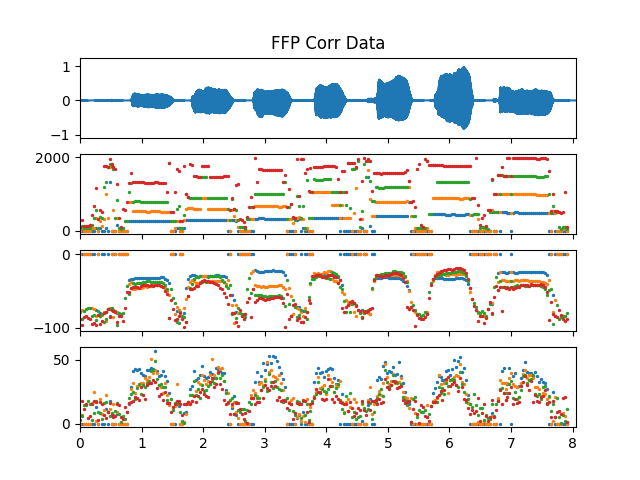
>>> fig, ax = plt.subplots(nrows=4, sharex=True)
>>> ax[0].set_title('FFP Corr Data')
>>> af.display.fill_wave(audio_arr, axes=ax[0])
>>> for i in range(cut_corr_arr.shape[0]):
>>>     ax[1].scatter(times, cut_corr_arr[i], s=2)
>>> for i in range(cut_db_arr.shape[0]):
>>>     ax[2].scatter(times, cut_db_arr[i], s=2)
>>> for i in range(cut_height_arr.shape[0]):
>>>     ax[3].scatter(times, cut_height_arr[i], s=2)
>>>
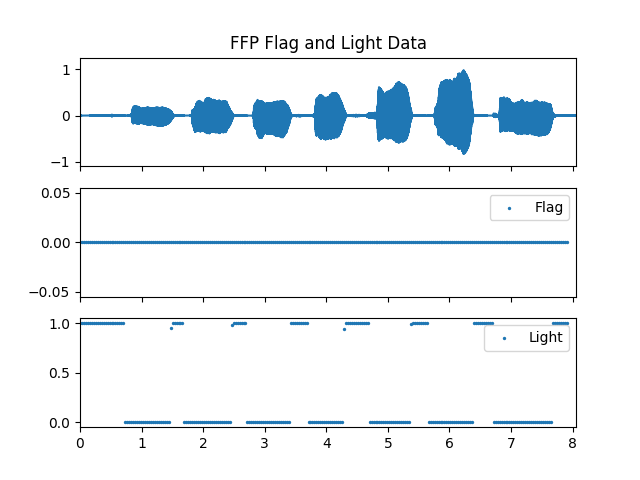
>>> # Show flag and light data plot
>>> fig, ax = plt.subplots(nrows=3, sharex=True)
>>> ax[0].set_title('FFP Flag and Light Data')
>>> af.display.fill_wave(audio_arr, axes=ax[0])
>>> ax[1].scatter(times, flag_arr, s=2, label='Flag')
>>> ax[1].legend()
>>> ax[2].scatter(times, light_arr, s=2, label='Light')
>>> ax[2].legend()
>>>
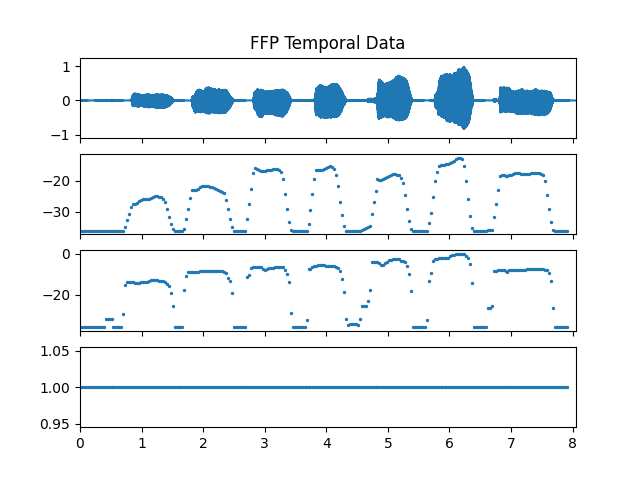
>>> # Show temporal data plot
>>> fig, ax = plt.subplots(nrows=4, sharex=True)
>>> ax[0].set_title('FFP Temporal Data')
>>> af.display.fill_wave(audio_arr, axes=ax[0])
>>> ax[1].scatter(times, avg_temp_arr, s=2)
>>> ax[2].scatter(times, max_temp_arr, s=2)
>>> ax[3].scatter(times, percent_temp_arr, s=2)
Methods
cal_time_length(data_length)Calculate the length of a frame from audio data.
pitch(data_arr[, has_corr_data, ...])Compute pitch
set_temp_base(temp_base)Set temproal base
- cal_time_length(data_length)
Calculate the length of a frame from audio data.
fft_length = 2 ** radix2_exp(data_length - fft_length) // slide_length + 1
- Parameters
- data_length: int
The length of the data to be calculated.
- Returns
- out: int
- set_temp_base(temp_base)
Set temproal base
- Parameters
- temp_base: float
temproal base
- pitch(data_arr, has_corr_data=False, has_cut_data=False, has_flag_data=False, has_light_data=False, has_temporal_data=False)
Compute pitch
- Parameters
- data_arr: np.ndarray [shape=(…, n)]
Input audio array
- has_corr_data: bool
If true, the extra_data_dic in the result will contain corr_data information.
corr_data includes four arrays: corr_arr, db_arr, height_arr, and len_arr.
- has_cut_data: bool
If true, the extra_data_dic in the result will contain cut_data information. cut_data contains only the first four sets of data from corr_data.
cut_data includes four arrays: corr_arr, db_arr, height_arr, and len_arr.
- has_flag_data: bool
If true, the extra_data_dic in the result will contain flag_data information.
flag_data contains one array, flag_arr.
- has_light_data: bool
If true, the extra_data_dic in the result will contain light_data information.
light_data contains one array, light_arr.
- has_temporal_data: bool
If true, the extra_data_dic in the result will contain temporal_data information.
temporal_data includes three arrays: avg_temp_arr, max_temp_arr, percent_temp_arr.
- Returns
- fre_arr: np.ndarray [shape=(…, time)]
frequency array. No data.
- db_arr: np.ndarray [shape=(…, time)]
db array
- extra_data_dic: (optional) dict
If all has_xx_data values are False, the extra_data_dic will not be included in the returned result.
If any has_xx_data is True, the extra_data_dic will include the corresponding data.