FST - Fast S-Transform
- class audioflux.FST(radix2_exp=12, min_index=1, max_index=None, samplate=32000)
Fast S-Transform (ST)
- Parameters
- radix2_exp: int
fft_length=2**radix2_exp- samplate: int
Sampling rate of the incoming audio.
- min_index: int
Min bank index.
Available range: (0, max_index)
- max_index: int
Max bank index.
Available range: (min_index, fft_length/2]
Examples
Read 880Hz audio data
>>> import audioflux as af
>>> audio_path = af.utils.sample_path('880')
>>> audio_arr, sr = af.read(audio_path)
>>> # FST can only input fft_length data
>>> # For radix2_exp=12, then fft_length=4096
>>> audio_arr = audio_arr[..., :4096]
Create FST object
>>> min_index, max_index = 1, 1024    # frequency is about 7.8125~8000Hz
>>> obj = af.FST(radix2_exp=12, min_index=min_index, max_index=max_index, samplate=sr)
Extract spectrogram
>>> import numpy as np
>>> spec_arr = obj.fst(audio_arr)
>>> spec_arr = np.abs(spec_arr)
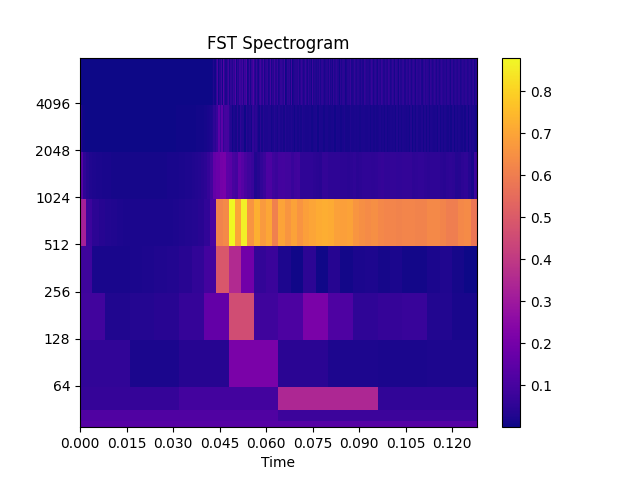
Show spectrogram plot
>>> import matplotlib.pyplot as plt
>>> from audioflux.display import fill_spec
>>> fig, ax = plt.subplots()
>>> img = fill_spec(spec_arr, axes=ax,
>>>                 x_coords=obj.x_coords(),
>>>                 y_coords=obj.y_coords(),
>>>                 x_axis='time', y_axis='log',
>>>                 title='FST Spectrogram')
>>> fig.colorbar(img, ax=ax)
Methods
fst(data_arr)Get spectrogram data
Get an array of FST frequency bands of different scales.
x_coords()Get the X-axis coordinate
y_coords()Get the Y-axis coordinate
- get_fre_band_arr()
Get an array of FST frequency bands of different scales.
- Returns
- out: np.ndarray [shape=(fre,)]
- fst(data_arr)
Get spectrogram data
- Parameters
- data_arr: np.ndarray [shape=(…, 2**radix2_exp)]
Input audio data
- Returns
- out: np.ndarray [shape=(…, fre, time), dtype=np.complex]
- y_coords()
Get the Y-axis coordinate
- Returns
- out: np.ndarray [shape=(fre,)]
- x_coords()
Get the X-axis coordinate
- Returns
- out: [shape=(time,)]