DWT - Discrete Wavelet Transform
- class audioflux.DWT(num=None, radix2_exp=12, samplate=32000, wavelet_type=WaveletDiscreteType.SYM, t1=4, t2=0)
Discrete Wavelet Transform (DWT)
- Parameters
- num: int or None
Number of frequency bins to generate.
If num is None, then
num = radix2_exp - 1- radix2_exp: int
fft_length=2**radix2_exp- samplate: int
Sampling rate of the incoming audio
- wavelet_type: WaveletDiscreteType
Wavelet discrete type
Note
t1/t2 settings for wavelet_type:
- DB: t1
2~10/20/30/40
- SYM: t1
2~10/20/30
- COIF: t1
1/2/3/4/5
- FK: t1
4/6/8/14/18/22
- BIOR/DMEY: t1.t2
1.1/1.3/1.5
2.2/2.4/2.6/2.8
3.1/3.3/3.5/3.7/3.9
4.4/5.5/6.8
- t1: int
t1 value
- t2: int
t2 value
Examples
Read 880Hz audio data
>>> import audioflux as af
>>> audio_path = af.utils.sample_path('880')
>>> audio_arr, sr = af.read(audio_path)
>>> audio_arr = audio_arr[..., :4096]
Create DWT object
>>> from audioflux.type import WaveletDiscreteType
>>> obj = af.DWT(num=11, radix2_exp=12, samplate=sr,
>>>              wavelet_type=WaveletDiscreteType.DB,
>>>              t1=4, t2=0)
Extract DWT data
>>> import numpy as np
>>> coef_arr, m_data_arr = obj.dwt(audio_arr)
>>> m_data_arr = np.abs(m_data_arr)
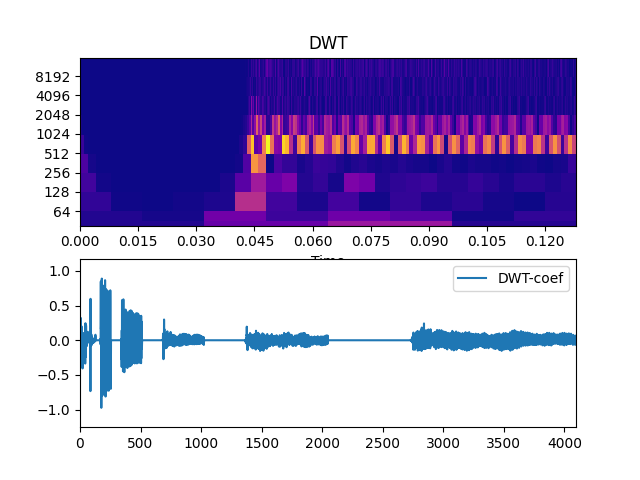
Show plot
>>> import matplotlib.pyplot as plt
>>> from audioflux.display import fill_spec, fill_plot
>>> fig, ax = plt.subplots(nrows=2)
>>> fill_spec(m_data_arr, axes=ax[0],
>>>           x_coords=obj.x_coords(),
>>>           y_coords=obj.y_coords(),
>>>           x_axis='time', y_axis='log',
>>>           title='DWT')
>>>
>>> fill_plot(np.arange(coef_arr.shape[-1]), coef_arr,
>>>           axes=ax[1], label='DWT-coef')
Methods
dwt(data_arr)Get dwt matrix
x_coords()Get the X-axis coordinate
y_coords()Get the Y-axis coordinate
get_fre_band_arr
- dwt(data_arr)
Get dwt matrix
- Parameters
- data_arr: np.ndarray [shape=(…, 2**radix2_exp)]
Input audio data
- Returns
- coef_arr: np.ndarray [shape=(…, time)]
- out: np.ndarray [shape=(…, fre, time)]
- y_coords()
Get the Y-axis coordinate
- Returns
- out: np.ndarray [shape=(fre,)]
- x_coords()
Get the X-axis coordinate
- Returns
- out: np.ndarray [shape=(time,)]