Deconv
- class audioflux.Deconv(num)
Deconvolution for spectrum, supports all spectrum types.
- Parameters
- num: int
Number of frequency bins to generate. It must be the same as the num parameter of the transformation (same as the spectrogram matrix).
Examples
Get a 880Hz’s audio file
>>> import audioflux as af
>>> sample_path = af.utils.sample_path('880')
>>> audio_arr, sr = af.read(sample_path)
Create BFT object and extract mel spectrogram
>>> import numpy as np
>>> from audioflux.type import SpectralFilterBankScaleType, SpectralDataType
>>> bft_obj = af.BFT(num=128, radix2_exp=12, samplate=sr,
>>>                  scale_type=SpectralFilterBankScaleType.MEL,
>>>                  data_type=SpectralDataType.POWER)
>>> spec_arr = bft_obj.bft(audio_arr)
>>> spec_arr = np.abs(spec_arr)
Create Deconv object and extract deconv
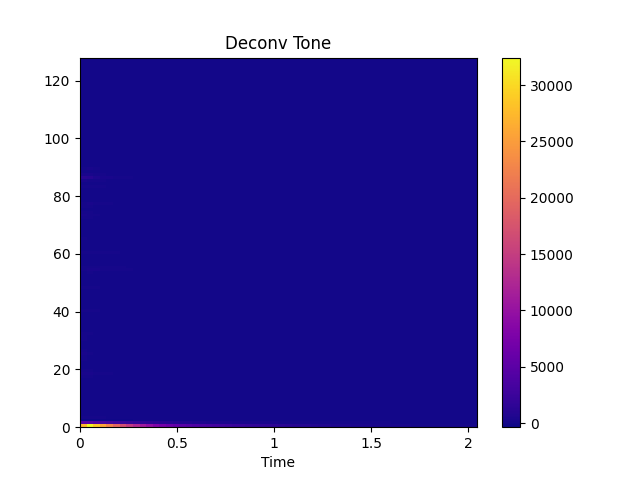
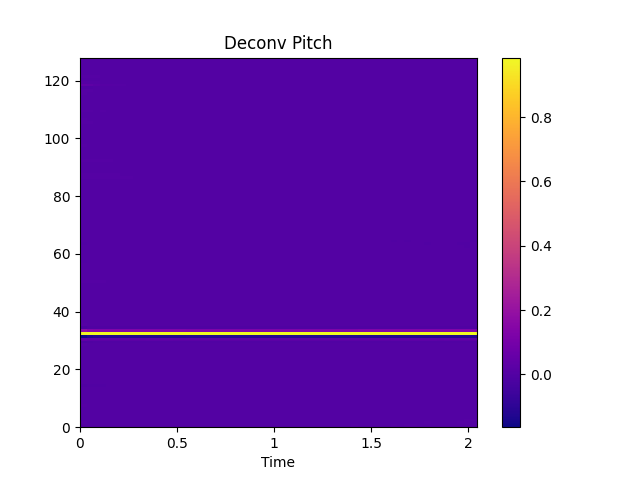
>>> deconv_obj = af.Deconv(bft_obj.num)
>>> deconv_obj.set_time_length(time_length=spec_arr.shape[1])
>>> tone_arr, pitch_arr = deconv_obj.deconv(spec_arr)
Display Deconv
>>> import matplotlib.pyplot as plt
>>> from audioflux.display import fill_spec
>>> audio_len = audio_arr.shape[-1]
>>> fig, ax = plt.subplots()
>>> img = fill_spec(tone_arr, axes=ax,
>>>           x_coords=bft_obj.x_coords(audio_len), x_axis='time',
>>>           title='Deconv Tone')
>>> fig.colorbar(img, ax=ax)
>>> fig, ax = plt.subplots()
>>> img = fill_spec(pitch_arr, axes=ax,
>>>           x_coords=bft_obj.x_coords(audio_len), x_axis='time',
>>>           title='Deconv Pitch')
>>> fig.colorbar(img, ax=ax)
Methods
deconv(m_data_arr)Compute the spectral deconv feature.
set_time_length(time_length)Set time length
- set_time_length(time_length)
Set time length
- Parameters
- time_length: int
- deconv(m_data_arr)
Compute the spectral deconv feature.
- Parameters
- m_data_arr: np.ndarray [shape=(…, fre, time)]
Spectrogram data.
- Returns
- m_tone_arr: np.ndarray [shape=(…, time)]
The matrix of tone
- m_pitch_arr: np.ndarray [shape=(…, time)]
The matrix of pitch