Cepstrogram
- class audioflux.Cepstrogram(radix2_exp=12, samplate=32000, window_type=WindowType.RECT, slide_length=1024)
Cepstrogram algorithm
- Parameters
- radix2_exp: int
fft_length=2**radix2_exp- samplate: int
Sampling rate of the incoming audio
- window_type: WindowType
Window type for each frame.
See:
type.WindowType- slide_length: int or None
Window sliding length.
Examples
Read guitar chord audio data
>>> import audioflux as af
>>> audio_path = af.utils.sample_path('guitar_chord2')
>>> audio_arr, sr = af.read(audio_path)
Extract Cepstrogram
>>> from audioflux.type import ReassignType, WindowType
>>> import numpy as np
>>> obj = af.Cepstrogram(radix2_exp=12, samplate=sr)
>>> cepstrums_arr, envelope_arr, details_arr = obj.cepstrogram(audio_arr)
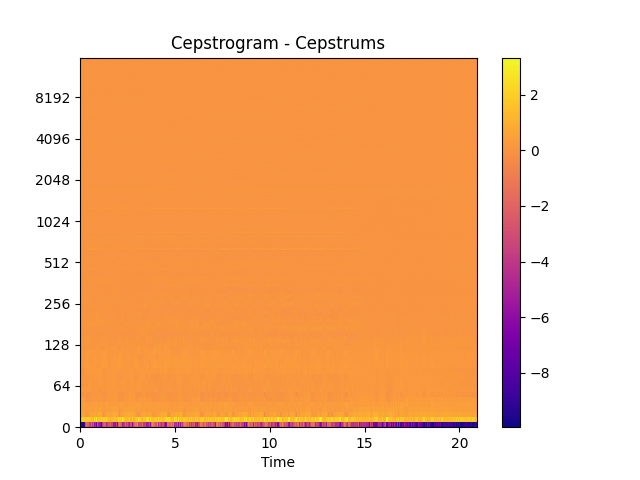
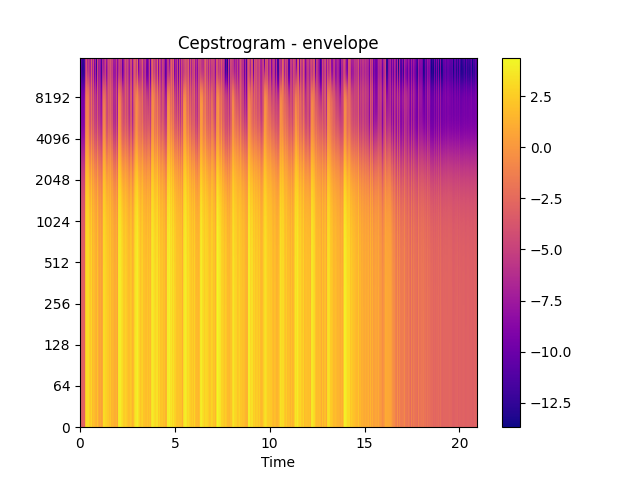
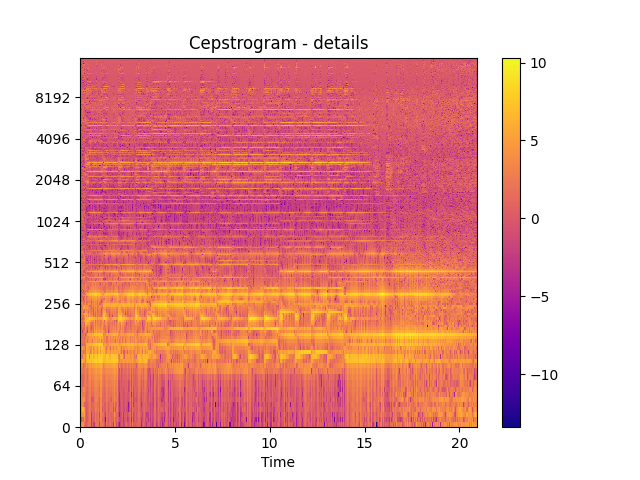
Show Cepstrogram plot
>>> import matplotlib.pyplot as plt
>>> from audioflux.display import fill_spec
>>> audio_len = audio_arr.shape[-1]
>>>
>>> fig, ax = plt.subplots()
>>> img = fill_spec(cepstrums_arr, axes=ax,
>>>                 x_coords=obj.x_coords(audio_len),
>>>                 y_coords=obj.y_coords(),
>>>                 x_axis='time', y_axis='log',
>>>                 title='Cepstrogram - Cepstrums')
>>> fig.colorbar(img, ax=ax)
>>>
>>> fig, ax = plt.subplots()
>>> img = fill_spec(envelope_arr, axes=ax,
>>>                 x_coords=obj.x_coords(audio_len),
>>>                 y_coords=obj.y_coords(),
>>>                 x_axis='time', y_axis='log',
>>>                 title='Cepstrogram - envelope')
>>> fig.colorbar(img, ax=ax)
>>>
>>> fig, ax = plt.subplots()
>>> img = fill_spec(details_arr, axes=ax,
>>>                 x_coords=obj.x_coords(audio_len),
>>>                 y_coords=obj.y_coords(),
>>>                 x_axis='time', y_axis='log',
>>>                 title='Cepstrogram - details')
>>> fig.colorbar(img, ax=ax)
>>>
Methods
cal_time_length(data_length)Calculate the length of a frame from audio data.
cepstrogram(data_arr[, cep_num])Get cepstrogram data
x_coords(data_length)Get the X-axis coordinate
y_coords()Get the Y-axis coordinate
- cal_time_length(data_length)
Calculate the length of a frame from audio data.
fft_length = 2 ** radix2_exp(data_length - fft_length) / slide_length + 1
- Parameters
- data_length: int
The length of the data to be calculated.
- Returns
- out: int
- cepstrogram(data_arr, cep_num=4)
Get cepstrogram data
- Parameters
- data_arr: np.ndarray [shape=(…, n)]
Input audio data
- cep_num: int, 4~128
formant estimate number
- Returns
- cepstrums: np.ndarray [shape=(…, fre, time), dtype=(np.float32)]
The matrix of cepstrums
- envelope: np.ndarray [shape=(…, fre, time), dtype=(np.float32)]
The matrix of envelope(formant)
- details: np.ndarray [shape=(…, fre, time), dtype=(np.float32)]
The matrix of details(tone)
- y_coords()
Get the Y-axis coordinate
- Returns
- out: np.ndarray [shape=(fre,)]
- x_coords(data_length)
Get the X-axis coordinate
- Parameters
- data_length: int
The length of the data to be calculated.
- Returns
- out: np.ndarray [shape=(time,)]