PWT - Pseudo Wavelet Transform
- class audioflux.PWT(num=84, radix2_exp=12, samplate=32000, low_fre=None, high_fre=None, bin_per_octave=12, scale_type=SpectralFilterBankScaleType.OCTAVE, style_type=SpectralFilterBankStyleType.SLANEY, normal_type=SpectralFilterBankNormalType.NONE, is_padding=True)
Pseudo Wavelet Transform (PWT).
- Parameters
- num: int
Number of frequency bins to generate, starting at low_fre.
- radix2_exp: int
fft_length=2**radix2_exp- samplate: int
Sampling rate of the incoming audio.
- low_fre: float or None
Lowest frequency.
Linear/Linsapce/Mel/Bark/Erb, low_fre>=0. default: 0.0
Octave/Log, low_fre>=32.703. default: 32.703(C1)
- high_fre: float or None
Highest frequency. Default is 16000(samplate/2).
Linear is not provided, it is based on
samplate / (2 ** radix2_exp).Octave is not provided, it is based on musical pitch.
- bin_per_octave: int
Number of bins per octave.
Only Octave must be provided.
- scale_type: SpectralFilterBankScaleType
Spectral filter bank type. It determines the type of spectrogram.
- style_type: SpectralFilterBankStyleType
Spectral filter bank style type. It determines the bank type of window.
- normal_type: SpectralFilterBankNormalType
Spectral filter normal type. It determines the type of normalization.
Linear is not provided.
- is_padding: bool
Whether to use padding.
Examples
Read 220Hz audio data
>>> import audioflux as af
>>> audio_path = af.utils.sample_path('220')
>>> audio_arr, sr = af.read(audio_path)
>>> # PWT can only input fft_length data
>>> # For radix2_exp=12, then fft_length=4096
>>> audio_arr = audio_arr[..., :4096]
Create PWT object of Octave
>>> from audioflux.type import (SpectralFilterBankScaleType, SpectralFilterBankStyleType,
>>>                             SpectralFilterBankNormalType)
>>> from audioflux.utils import note_to_hz
>>> obj = af.PWT(num=84, radix2_exp=12, samplate=sr,
>>>               low_fre=note_to_hz('C1'), bin_per_octave=12,
>>>               scale_type=SpectralFilterBankScaleType.OCTAVE,
>>>               style_type=SpectralFilterBankStyleType.SLANEY,
>>>               normal_type=SpectralFilterBankNormalType.NONE)
Extract spectrogram
>>> import numpy as np
>>> spec_arr = obj.pwt(audio_arr)
>>> spec_arr = np.abs(spec_arr)
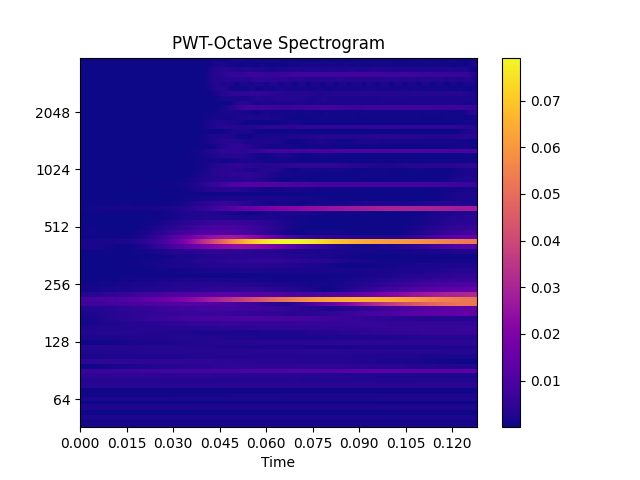
Show spectrogram plot
>>> import matplotlib.pyplot as plt
>>> from audioflux.display import fill_spec
>>> fig, ax = plt.subplots()
>>> img = fill_spec(spec_arr, axes=ax,
>>>                 x_coords=obj.x_coords(),
>>>                 y_coords=obj.y_coords(),
>>>                 x_axis='time', y_axis='log',
>>>                 title='PWT-Octave Spectrogram')
>>> fig.colorbar(img, ax=ax)
Methods
Get bin band array
Get an array of frequency bands of different scales.
pwt(data_arr)Get spectrogram data
x_coords()Get the X-axis coordinate
y_coords()Get the Y-axis coordinate
- get_fre_band_arr()
Get an array of frequency bands of different scales. Based on the scale_type determination of the initialization.
- Returns
- out: np.ndarray [shape=(fre, )]
- get_bin_band_arr()
Get bin band array
- Returns
- out: np.ndarray [shape=[n_bin,]]
- pwt(data_arr)
Get spectrogram data
- Parameters
- data_arr: np.ndarray [shape=(…, 2**radix2_exp)]
Audio data array
- Returns
- out: np.ndarray [shape=(…, fre, time), dtype=np.complex]
The matrix of PWT
- y_coords()
Get the Y-axis coordinate
- Returns
- out: np.ndarray [shape=(fre,)]
- x_coords()
Get the X-axis coordinate
- Returns
- out: np.ndarray [shape=(time,)]