audioflux.MelSpectrogram
- class audioflux.MelSpectrogram(num=0, samplate=32000, low_fre=None, high_fre=None, radix2_exp=12, window_type=None, slide_length=None, data_type=SpectralDataType.POWER, style_type=SpectralFilterBankStyleType.SLANEY, normal_type=SpectralFilterBankNormalType.NONE)
Mel spectrogram class.
- Parameters
- num: int
Number of frequency bins to generate, starting at low_fre.
- samplate: int
Sampling rate of the incoming audio
- low_fre: float or None
Lowest frequency. default: 0.0
- high_fre: float
Highest frequency. default: 16000(samplate/2)
- radix2_exp: int
fft_length=2**radix2_exp- window_type: WindowType
Window type. default: hann
See:
type.WindowType- slide_length: int
Window sliding length
- data_type: SpectralDataType
Spectrogram data type.
It cat be set to mag or power. If you needs db type, you can set power type and then call the power_to_db method.
- style_type: SpectralFilterBankStyleType
Spectral filter bank style type. It determines the bank type of window.
- normal_type: SpectralFilterBankNormalType
Spectral filter normal type. It determines the type of normalization.
See also
Examples
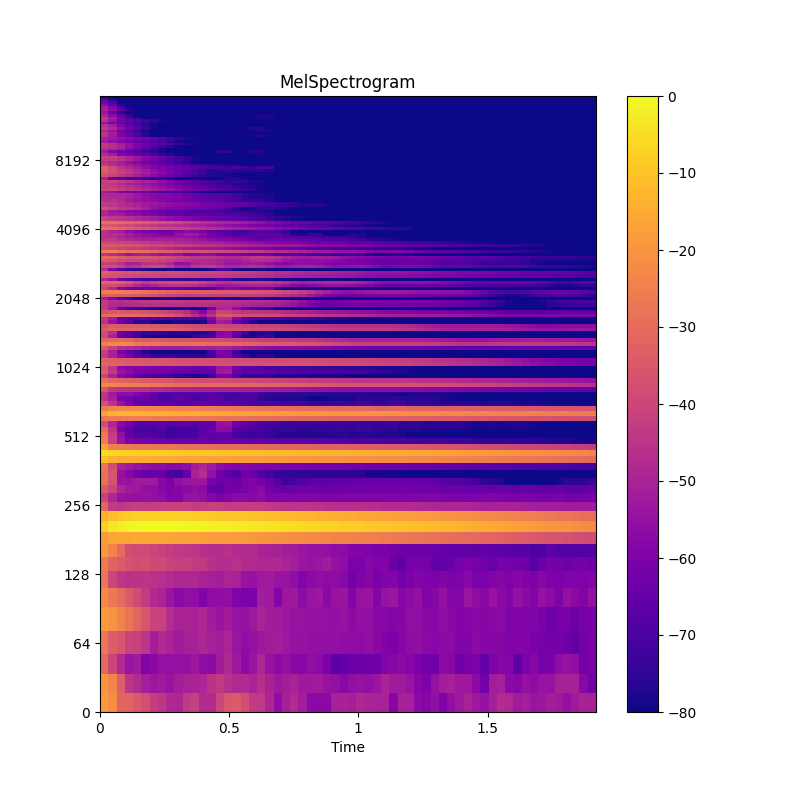
Get 220hz audio
>>> import audioflux as af
>>> path = af.utils.sample_path('220')
>>> audio_arr, sr = af.read(path)
Get mel spectrogram data
>>> spec_obj = af.MelSpectrogram(num=128, samplate=32000, radix2_exp=12)
>>> spec_arr = spec_obj.spectrogram(audio_arr)
>>> spec_dB_arr = af.utils.power_to_db(spec_arr)
Show plot
>>> from audioflux.display import Plot
>>> audio_len = audio_arr.shape[-1]
>>> pt = Plot()
>>> pt.add_spec_data(spec_dB_arr,
...                  x_coords=spec_obj.x_coords(audio_len),
...                  y_coords=spec_obj.y_coords(),
...                  scale='log', title='MelSpectrogram')
Methods
cal_time_length(data_length)Calculate the length of a frame from audio data.
get_bin_band_arr()Get bin band array
get_bin_band_length()Get bin band length
get_fre_band_arr()Get frequency band array
spectrogram(data_arr[, is_phase_arr])Get spectrogram data
x_coords(data_length)Get the X-axis coordinate
y_coords()Get the Y-axis coordinate