CQT
- class audioflux.CQT(num=84, samplate=32000, low_fre=32.70319566257483, bin_per_octave=12, factor=1.0, beta=0.0, thresh=0.01, window_type=WindowType.HANN, slide_length=None, normal_type=SpectralFilterBankNormalType.AREA, is_scale=True)
Constant-Q transform (CQT)
- Parameters
- num: int
Number of frequency bins to generate, starting at low_fre.
Usually:
num = octave * bin_per_octave, default: 84 (7 * 12)- samplate: int:
Sampling rate of the incoming audio.
- low_fre: float
Lowest frequency. default: 32.703(C1)
- bin_per_octave: int
Number of bins per octave.
- factor: float
Factor value
- beta: float
Beta value
- thresh: float
Thresh value
- window_type: WindowType
Window type for each frame.
See:
type.WindowType- slide_length: int or None
Window sliding length.
- normal_type: SpectralFilterBankNormalType
Spectral filter normal type. It determines the type of normalization.
- is_scale: bool
Whether to use scale.
Examples
Read 220Hz audio data
>>> import audioflux as af
>>> audio_path = af.utils.sample_path('220')
>>> audio_arr, sr = af.read(audio_path)
Create CQT object
>>> from audioflux.type import SpectralFilterBankNormalType
>>> from audioflux.utils import note_to_hz
>>> obj = af.CQT(num=84, samplate=sr, low_fre=note_to_hz('C1'), bin_per_octave=12,
>>>              slide_length=1024, normal_type=SpectralFilterBankNormalType.AREA)
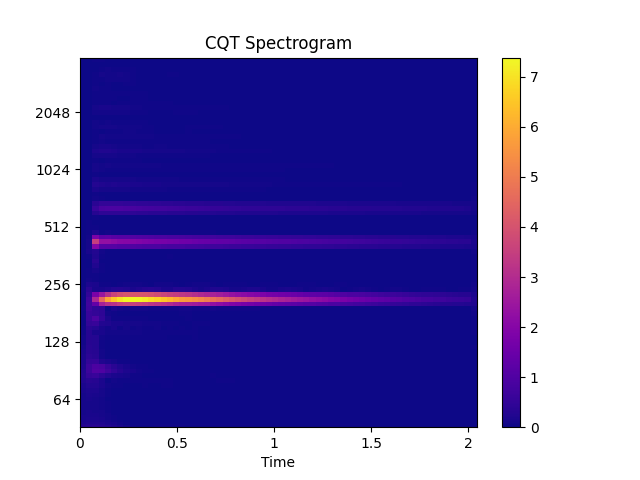
Extract CQT spectrogram
>>> import numpy as np
>>> spec_arr = obj.cqt(audio_arr)
>>> spec_mag_arr = np.abs(spec_arr)
Show CQT spectrogram plot
>>> import matplotlib.pyplot as plt
>>> from audioflux.display import fill_spec
>>> audio_len = audio_arr.shape[0]
>>> fig, ax = plt.subplots()
>>> img = fill_spec(spec_mag_arr, axes=ax,
>>>           x_coords=obj.x_coords(audio_len),
>>>           y_coords=obj.y_coords(),
>>>           x_axis='time', y_axis='log',
>>>           title='CQT Spectrogram')
>>> fig.colorbar(img, ax=ax)
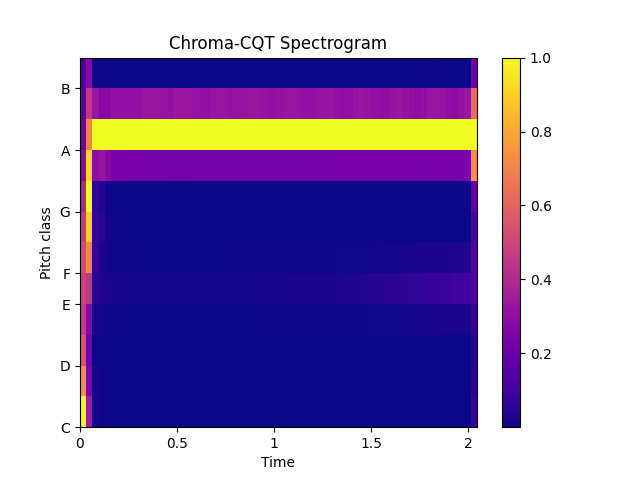
Extract Chroma-cqt data
>>> chroma_arr = obj.chroma(spec_arr, chroma_num=12)
array([[2.28795856e-01, 1.27659831e-02, 5.76458964e-03, ...,
        1.08233641e-03, 1.06033171e-03, 8.46851245e-02],
       ...,
       [3.88875484e-01, 4.20701923e-03, 1.00626342e-03, ...,
        7.09769898e-04, 3.13778268e-03, 2.85723597e-01]], dtype=float32)
Show Chroma-CQT spectrogram plot
>>> fig, ax = plt.subplots()
>>> img = fill_spec(chroma_arr, axes=ax,
>>>           x_coords=obj.x_coords(audio_len),
>>>           x_axis='time', y_axis='chroma',
>>>           title='Chroma-CQT Spectrogram')
>>> fig.colorbar(img, ax=ax)
Methods
cal_time_length(data_length)Calculate the length of a frame from audio data.
chroma(m_cqt_data[, chroma_num, data_type, ...])Calculate the chroma matrix of CQT
cqcc(m_data_arr, cc_num, rectify_type)Compute the spectral cqcc feature.
cqhc(m_data_arr[, hc_num])Compute the spectral cqhc feature.
cqt(data_arr)Get spectrogram data
deconv(m_data_arr)Compute the spectral deconv feature.
get_fft_length()Get fft_length
get_fre_band_arr()Get an array of frequency bands of CQT scales.
set_scale(flag)Set scale
x_coords(data_length)Get the X-axis coordinate
y_coords()Get the Y-axis coordinate of CQT
- cal_time_length(data_length)
Calculate the length of a frame from audio data.
(data_length - fft_length) / slide_length + 1- Parameters
- data_length: int
The length of the data to be calculated.
- Returns
- out: int
- get_fft_length()
Get fft_length
- Returns
- out: int
- get_fre_band_arr()
Get an array of frequency bands of CQT scales.
- Returns
- out: np.ndarray [shape=(fre,)]
- set_scale(flag)
Set scale
- Parameters
- flag: int
- cqt(data_arr)
Get spectrogram data
- Parameters
- data_arr: np.ndarray [shape=(n)]
Input audio data
- Returns
- out: np.ndarray [shape=(fre, time)]
- chroma(m_cqt_data, chroma_num=12, data_type=SpectralDataType.POWER, norm_type=ChromaDataNormalType.MAX)
Calculate the chroma matrix of CQT
- Parameters
- m_cqt_data: np.ndarray [shape=(fre, time), dtype=np.complex]
CQT spectrogram matrix, call the cqt method to get.
- chroma_num: int
Number of chroma bins to produce
- data_type: SpectralDataType
Data type of CQT spectrogram matrix
- norm_type: ChromaDataNormalType
Normalization type of chroma
- Returns
- out: np.ndarray [shape=(chroma_num, time)]
- cqcc(m_data_arr, cc_num, rectify_type) ndarray
Compute the spectral cqcc feature.
- Parameters
- m_data_arr: np.ndarray [shape=(fre, time)]
CQT spectrogram matrix, call the cqt method to get.
- data_type:
mag:
np.abs(D)power:
np.abs(D) ** 2
If data of np.complex type is passed in, the default is power
- cc_num: int
Number of cc to produce
- rectify_type: CepstralRectifyType
Rectify type
- Returns
- out: np.ndarray [shape=(cc_num, time)]
- cqhc(m_data_arr, hc_num=20) ndarray
Compute the spectral cqhc feature.
- Parameters
- m_data_arr: np.ndarray [shape=(fre, time)]
CQT spectrogram matrix, call the cqt method to get.
- data_type:
mag:
np.abs(D)power:
np.abs(D) ** 2
If data of np.complex type is passed in, the default is power
- hc_num: int
Number of hc to produce
- Returns
- out: np.ndarray [shape=(hc_num, time)]
- deconv(m_data_arr) -> (<class 'numpy.ndarray'>, <class 'numpy.ndarray'>)
Compute the spectral deconv feature.
- Parameters
- m_data_arr: np.ndarray [shape=(fre, time)]
CQT spectrogram matrix, call the cqt method to get.
- data_type:
mag:
np.abs(D)power:
np.abs(D) ** 2
If data of np.complex type is passed in, the default is mag
- Returns
- m_tone_arr: np.ndarray [shape=(…, time)]
The matrix of tone
- m_pitch_arr: np.ndarray [shape=(…, time)]
The matrix of pitch
- y_coords()
Get the Y-axis coordinate of CQT
- Returns
- out: np.ndarray [shape=(fre,)]
- x_coords(data_length)
Get the X-axis coordinate
- Parameters
- data_length: int
The length of the data to be calculated.
- Returns
- out: np.ndarray [shape=(time,)]